Barack Obama was the president of the united states between January 20, 2009, to January 20, 2017. Can statistical models show us, what where the main topics president Obama wrote about on Facebook? Let's see!
How did I obtain the data
I acquired the data from the official Facebook API last year. This was before the Cambridge Analytica Scandal, which made Facebook apply many more restrictions to its API. During the period of January 20, 2009 to January 20, 2017, president Obama posted 2791 Facebook posts which we are going to analyze.
Highlight
I obtained the data using the official Fabook API before the Cambridge Analytica Scandal.
The number of main topics president Obama mainly wrote about on Facebook is 13.
Some of the main topics are
- the weekly address
- affordable care and health insurance
- gun violence
- supreme court and Obama Care
- oil spill in New Orleans
- Pete Souza
Method
Why a statistical model?
Imagine we have a set of many scientific articles (probably millions of them!) representing few topics (like biology, mathematics, physics and economics). And assume our goal is to classify all the articles to one of the topics. To avoid analyzing each article by reading and evaluating it, we can employ a statistical model, which will classify all the articles within a few minutes! This task is called classification.
Which statistical model?
There are many different models for classification of objects ( SVM, decision trees, boosting algorithms, multinomial logistic regression, ...). Based on the problem and type of the objects to be classified, the researcher should choose a proper model. I needed a model which is unsupervised. In addition, I needed a model that is good with textual data. Therefore, I decided to use Topic Model algorithm.
This model assumes the set of documents are articulating about one of the few topics. And each topic is assumed to frequently use few specific words which appear with little probability in other topics. As example, the scientific articles with topic biology would use the word "cell" with probability 95% but the same word might be used with probability 2% within the articles with topic mathematics. "Topic models are referred to as probabilistic topic models, which refers to statistical algorithms for discovering the latent semantic structures of an extensive text body" ( LINK).
Which programming platform?
The topic model algorithem is implemented in almost all statistical packages. For this short article we chose one of the straightforward implementations in R. This implementation beside being simple and flexible, has many other features. For example one can parallelize it in order to speed up the computations, and there are also many interactive visualization tools to visualize the results. The R libraries we used are data.table, doParallel, text2vec, tm, ldatuning, topicmodels and LDAvis.

Results
Number of topics
On of the main questions in unsupervised classification algorithms is, how many clusters (topics) do the objects belong to? To answer this question, I used the method introduced by TL Griffiths, which is implemented in ldatuning package. The optimum number of classes would be the number which maximizes the function introduced in the mentioned article. Therefore, I decided to choose 30 topics, as this number almost maximizes the value of the objective function. One could choose a higher number of topics(e.g. 50), but I think adding more topics in this case does not add much more insights.
visualization of the Results
So far I decided to classify the Facebook posts of president Obama among 30 latent topics. I can use the LDA function of the topicmodels package in order to run the classification. The next step would be to visualize the results. To visualize the results, I decided to use the serVis function of LDAvis package. I applied a t-distributed stochastic neighbor embedding for the best visualisation result.
The visualization has 2 main panels. On the left panel one can see 30 circles, representing 30 topics. If you hover your mouse on top of one of the circles, you can see the most important keywords of that topic on the left panel. One can also hover the mouse on one of the keywords on the left panel in order to check which topics use that keyword.
The first 3 keywords of each topic are listed in the table below.
| Topic | Keywords 1 | Keywords 2 | Keywords 3 | Keywords 4 |
|---|---|---|---|---|
| Topic 1 | 0.0238 | 0.0238 | 0.0231 | 0.0072 |
| Topic 2 | 0.0021 | 0.0021 | 0.0019 | 0.0019 |
| Topic 3 | 0.0149 | 0.0140 | 0.0140 | 0.0080 |
| Topic 4 | 0.0096 | 0.0043 | 0.0028 | 0.0028 |
| Topic 5 | 0.0197 | 0.0050 | 0.0039 | 0.0035 |
| Topic 6 | 0.0074 | 0.0053 | 0.0053 | 0.0052 |
| Topic 7 | 0.0041 | 0.0016 | 0.0014 | 0.0013 |
| Topic 8 | 0.0016 | 0.0010 | 0.0010 | 0.0009 |
| Topic 9 | 0.0014 | 0.0013 | 0.0011 | 0.0011 |
| Topic 10 | 0.0034 | 0.0017 | 0.0017 | 0.0014 |
| Topic 11 | 0.0020 | 0.0016 | 0.0006 | 0.0006 |
| Topic 12 | 0.0009 | 0.0007 | 0.0006 | 0.0006 |
| Topic 13 | 0.0009 | 0.0006 | 0.0006 | 0.0006 |
| Topic 14 | 0.0010 | 0.0006 | 0.0006 | 0.0006 |
| Topic 15 | 0.0013 | 0.0010 | 0.0009 | 0.0009 |
| Topic 16 | 0.0029 | 0.0013 | 0.0010 | 0.0009 |
| Topic 17 | 0.0016 | 0.0015 | 0.0009 | 0.0009 |
| Topic 18 | 0.0007 | 0.0007 | 0.0006 | 0.0006 |
| Topic 19 | 0.0026 | 0.0007 | 0.0007 | 0.0006 |
| Topic 20 | 0.0111 | 0.0027 | 0.0026 | 0.0017 |
| Topic 21 | 0.0012 | 0.0007 | 0.0007 | 0.0007 |
| Topic 22 | 0.0013 | 0.0012 | 0.0012 | 0.0010 |
| Topic 23 | 0.0012 | 0.0012 | 0.0010 | 0.0010 |
| Topic 24 | 0.0012 | 0.0009 | 0.0007 | 0.0006 |
| Topic 25 | 0.0010 | 0.0006 | 0.0006 | 0.0006 |
| Topic 26 | 0.0012 | 0.0010 | 0.0007 | 0.0006 |
| Topic 27 | 0.0010 | 0.0009 | 0.0007 | 0.0006 |
| Topic 28 | 0.0022 | 0.0013 | 0.0009 | 0.0007 |
| Topic 29 | 0.0009 | 0.0006 | 0.0006 | 0.0006 |
| Topic 30 | 0.0018 | 0.0009 | 0.0009 | 0.0007 |
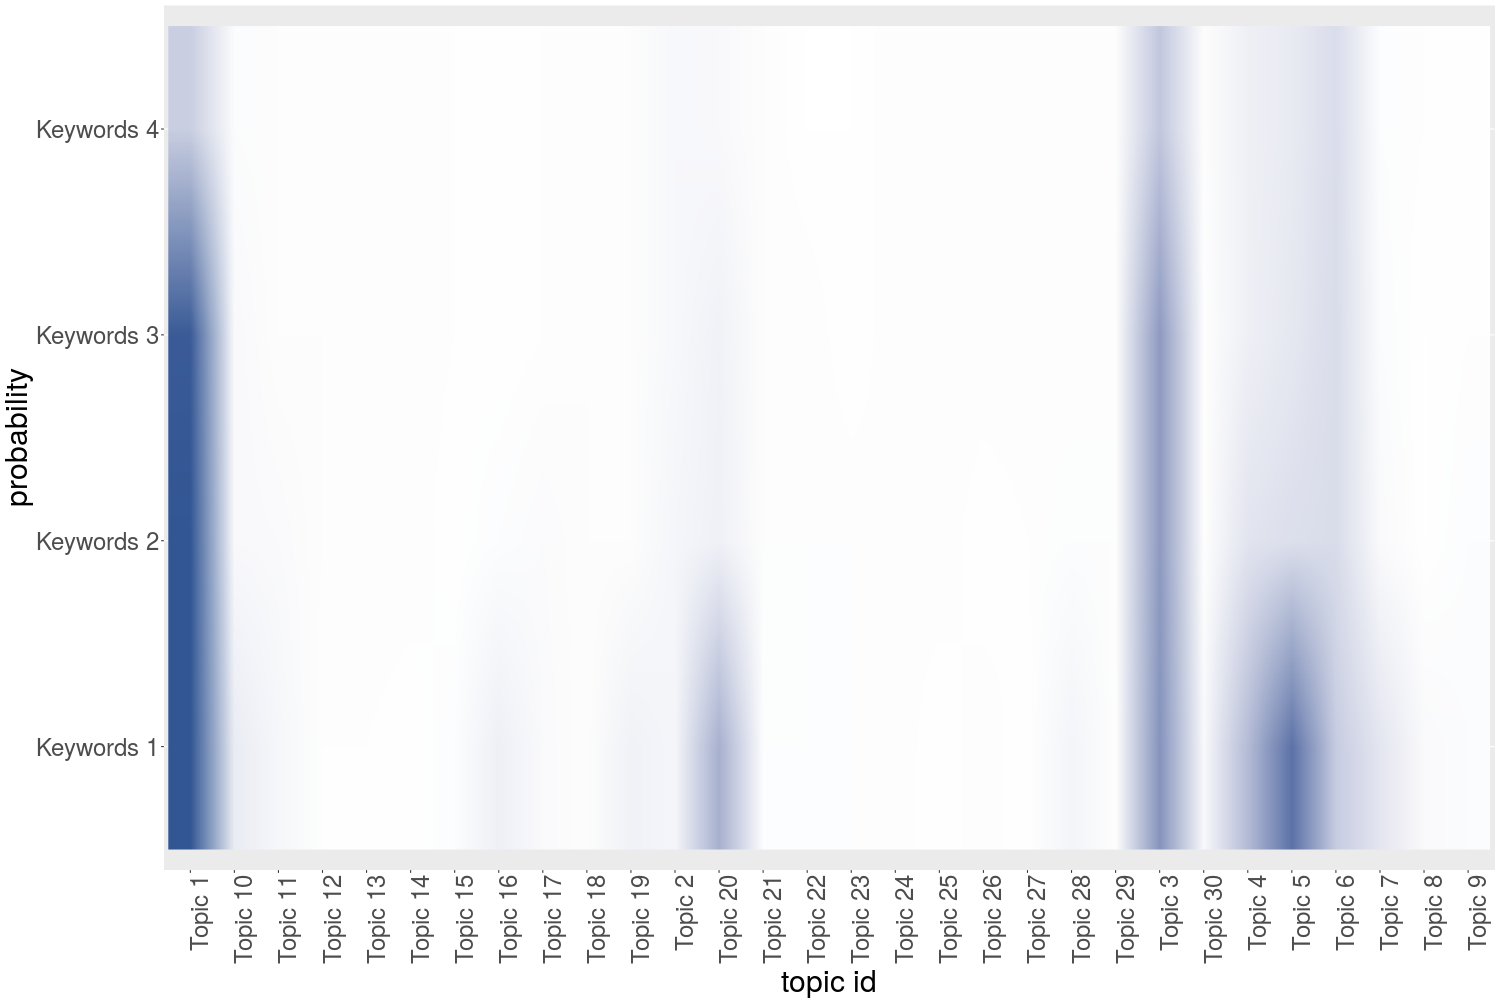
What comes next?
In the last plot you can see the list of the topics and the importance level of the first 4 keywords on the X and Y axis respectively. As you can see, only few topics contain highly important keywords. This problem appears because each document (each Facebook post) is made of few words, not making it easy for the algorithm to identify strong connections. Regardless of that, the model gives us pretty good insights on the topics that president Obama wrote about.